mpm | inner_membrane_proteins Inner Membrane Proteins
copyrightText written by Wikipedia and contributors. Used under a Creative Commons Attribution-Sharealike 3.0 Unported License. View original or read terms.


Statistics
Shown below are histograms for all MemProtMD entries in grey and for this collection only in blue. Densities for all entries and for this collection are individually normalised. Publication date, resolution and experimental_method are taken directly from the PDB record, whilst membrane thickness is derived from MemProtMD simulations.
Publication date
Experimental method
Resolution
Membrane thickness
Simulations available


Simulation 1pw4_default_dppc
Images
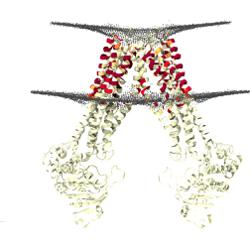
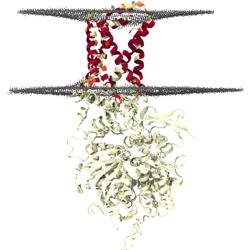
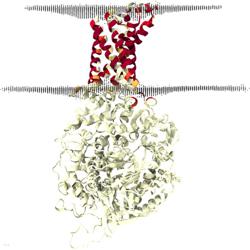
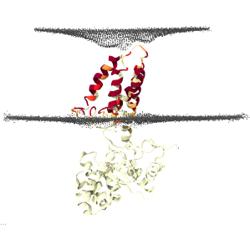
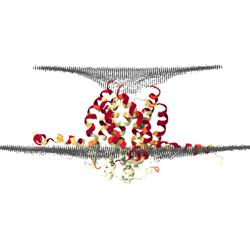
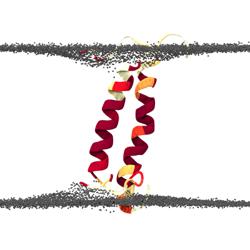
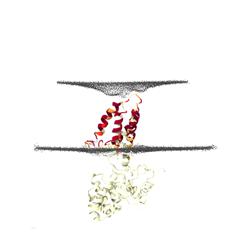
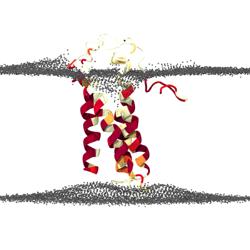
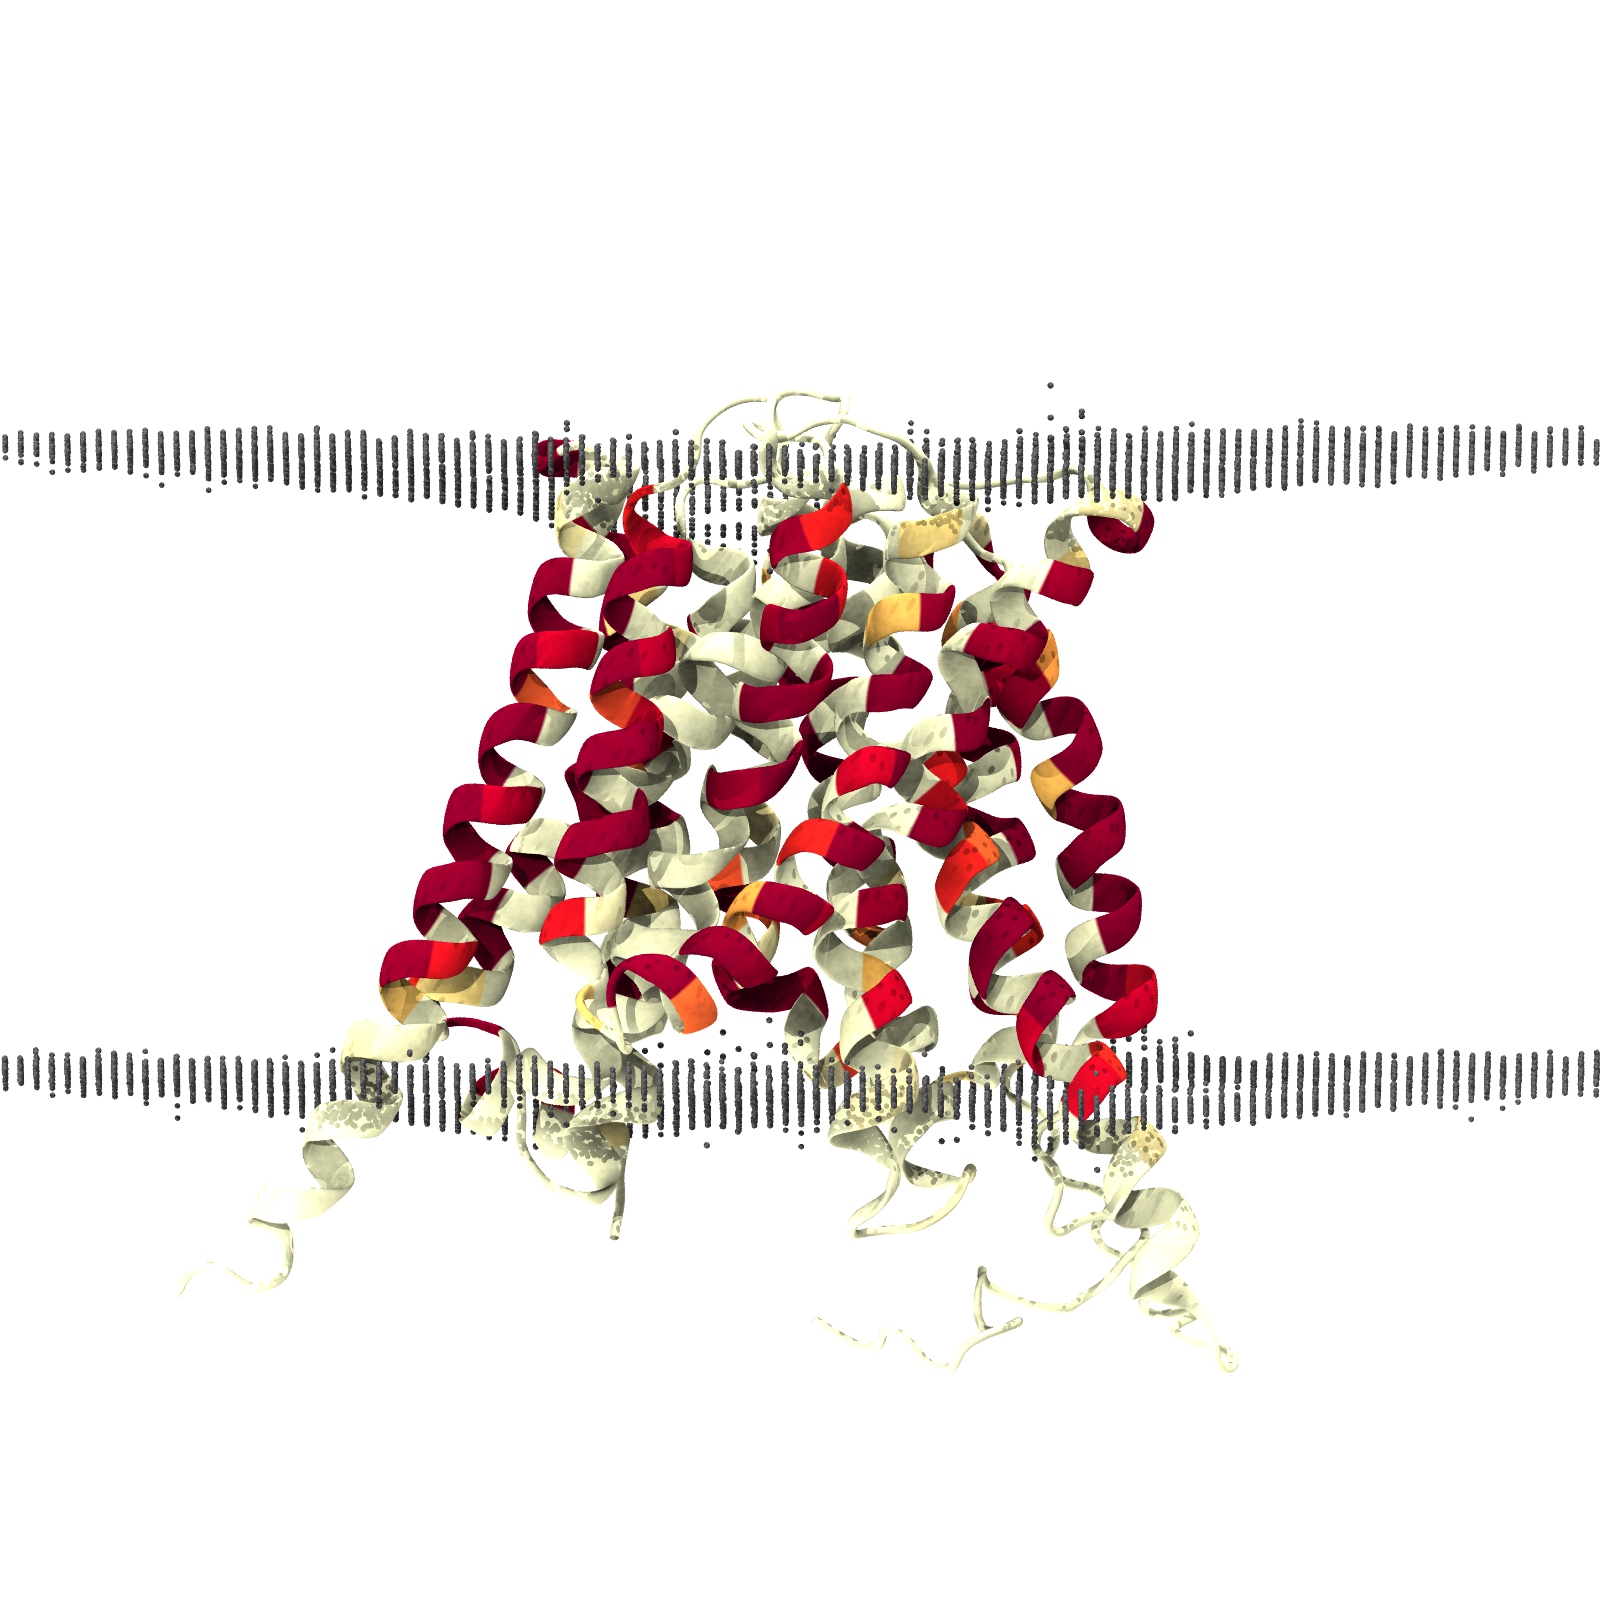
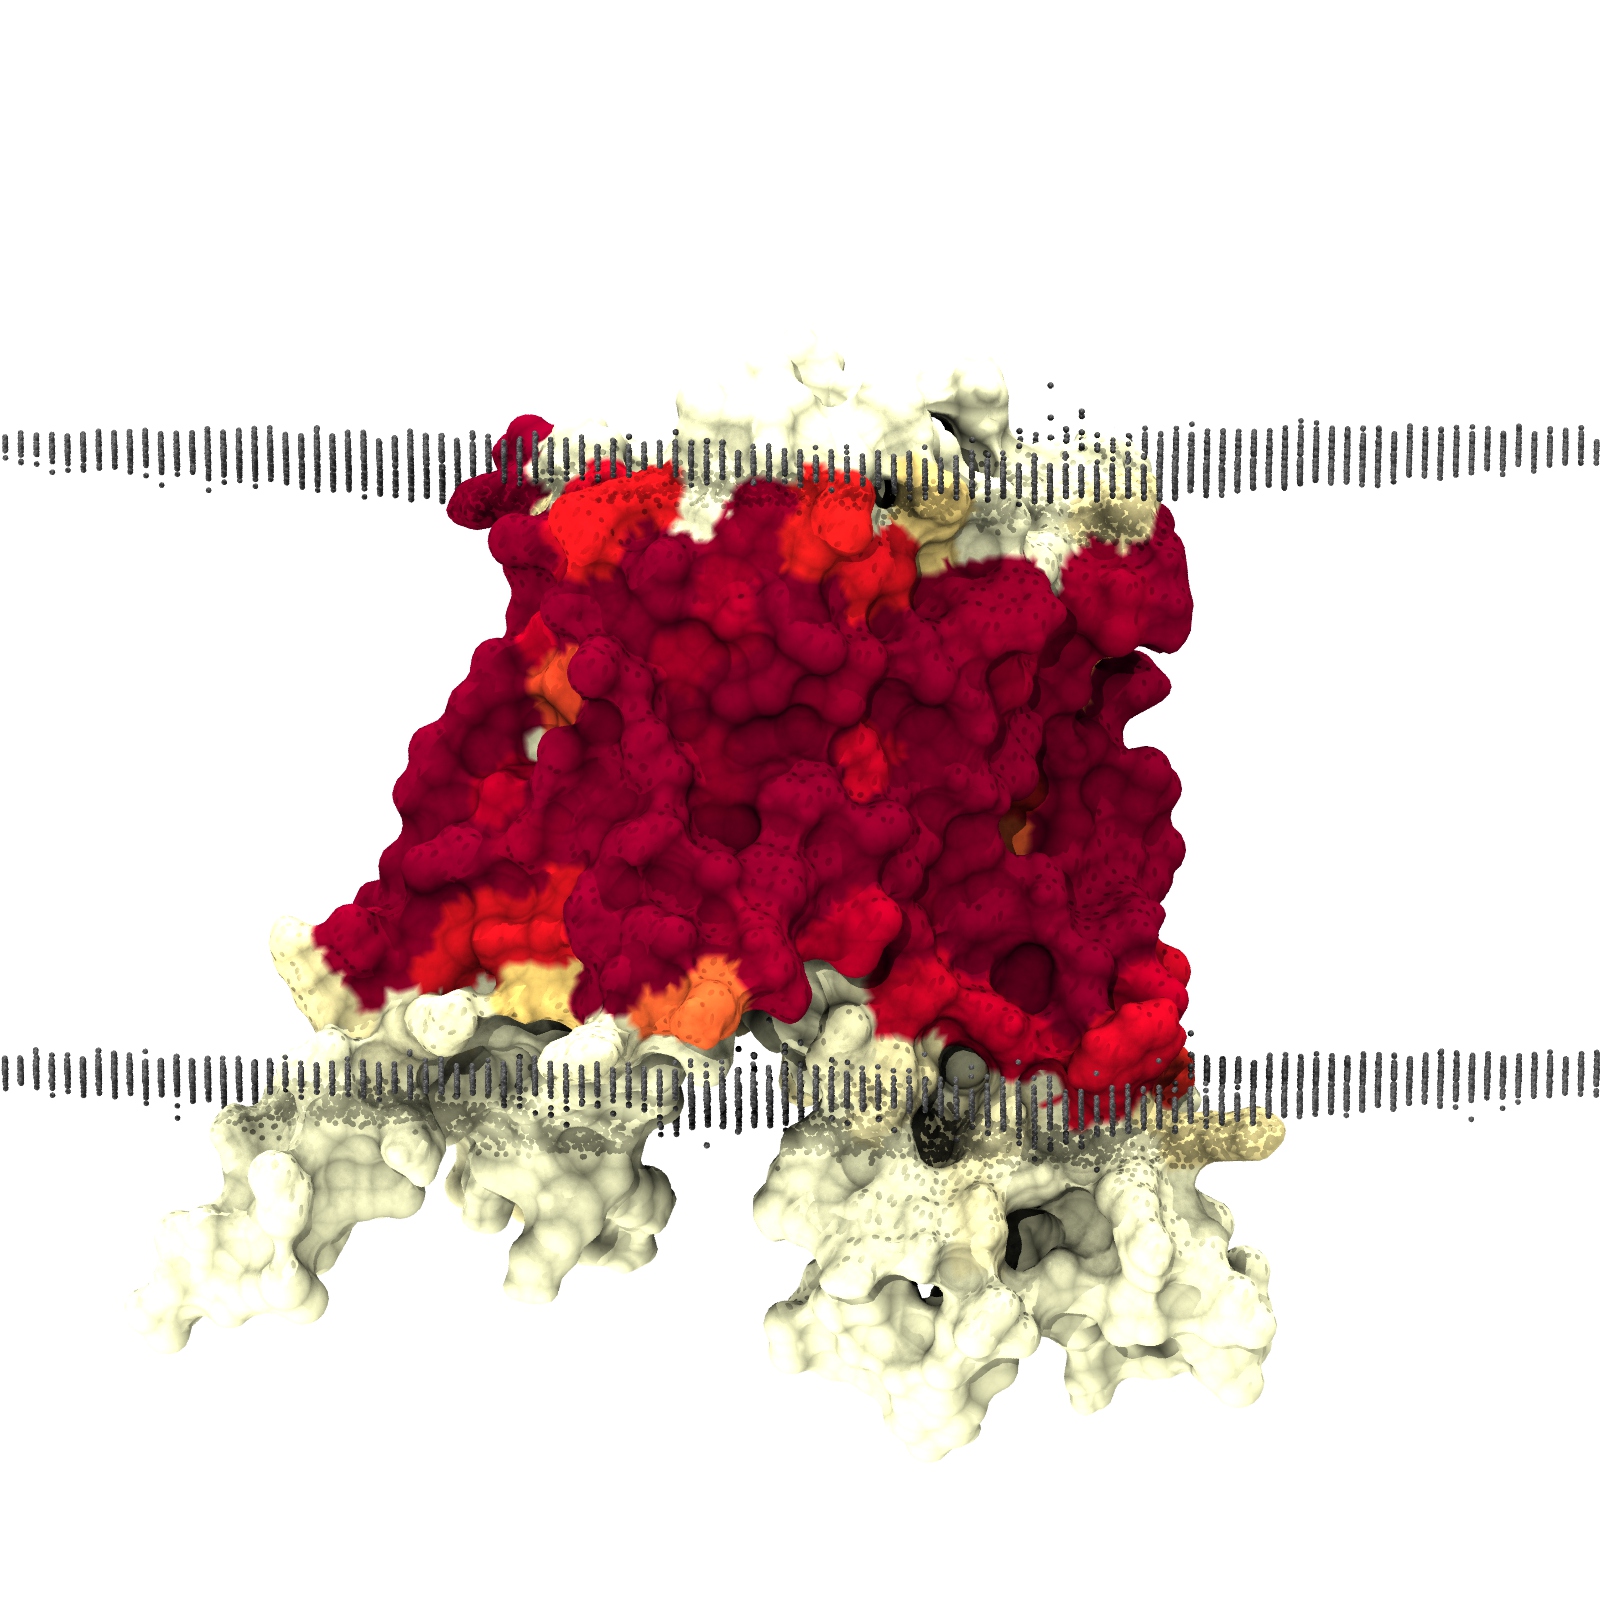
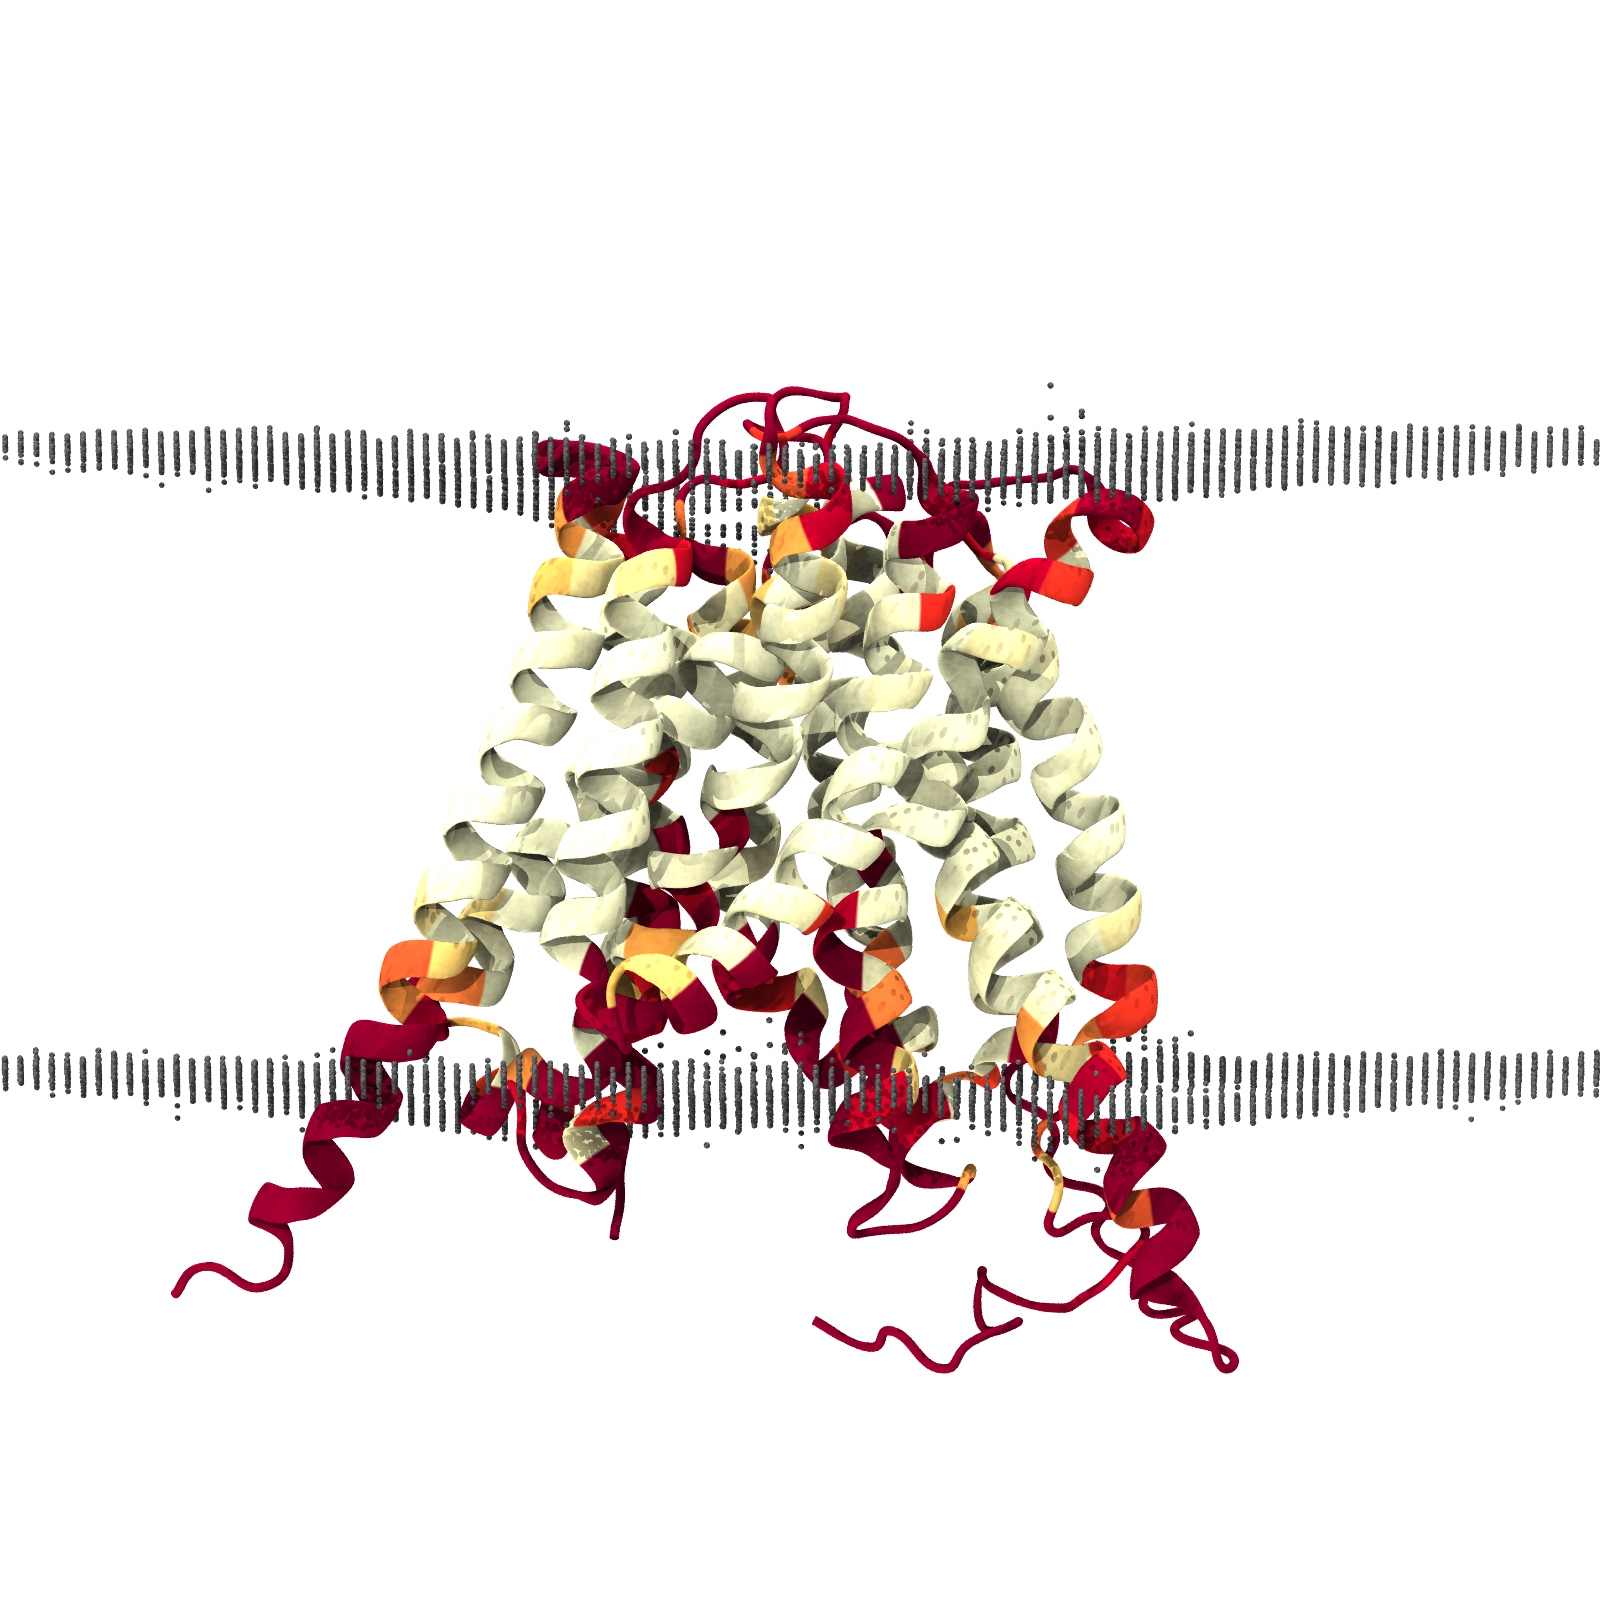
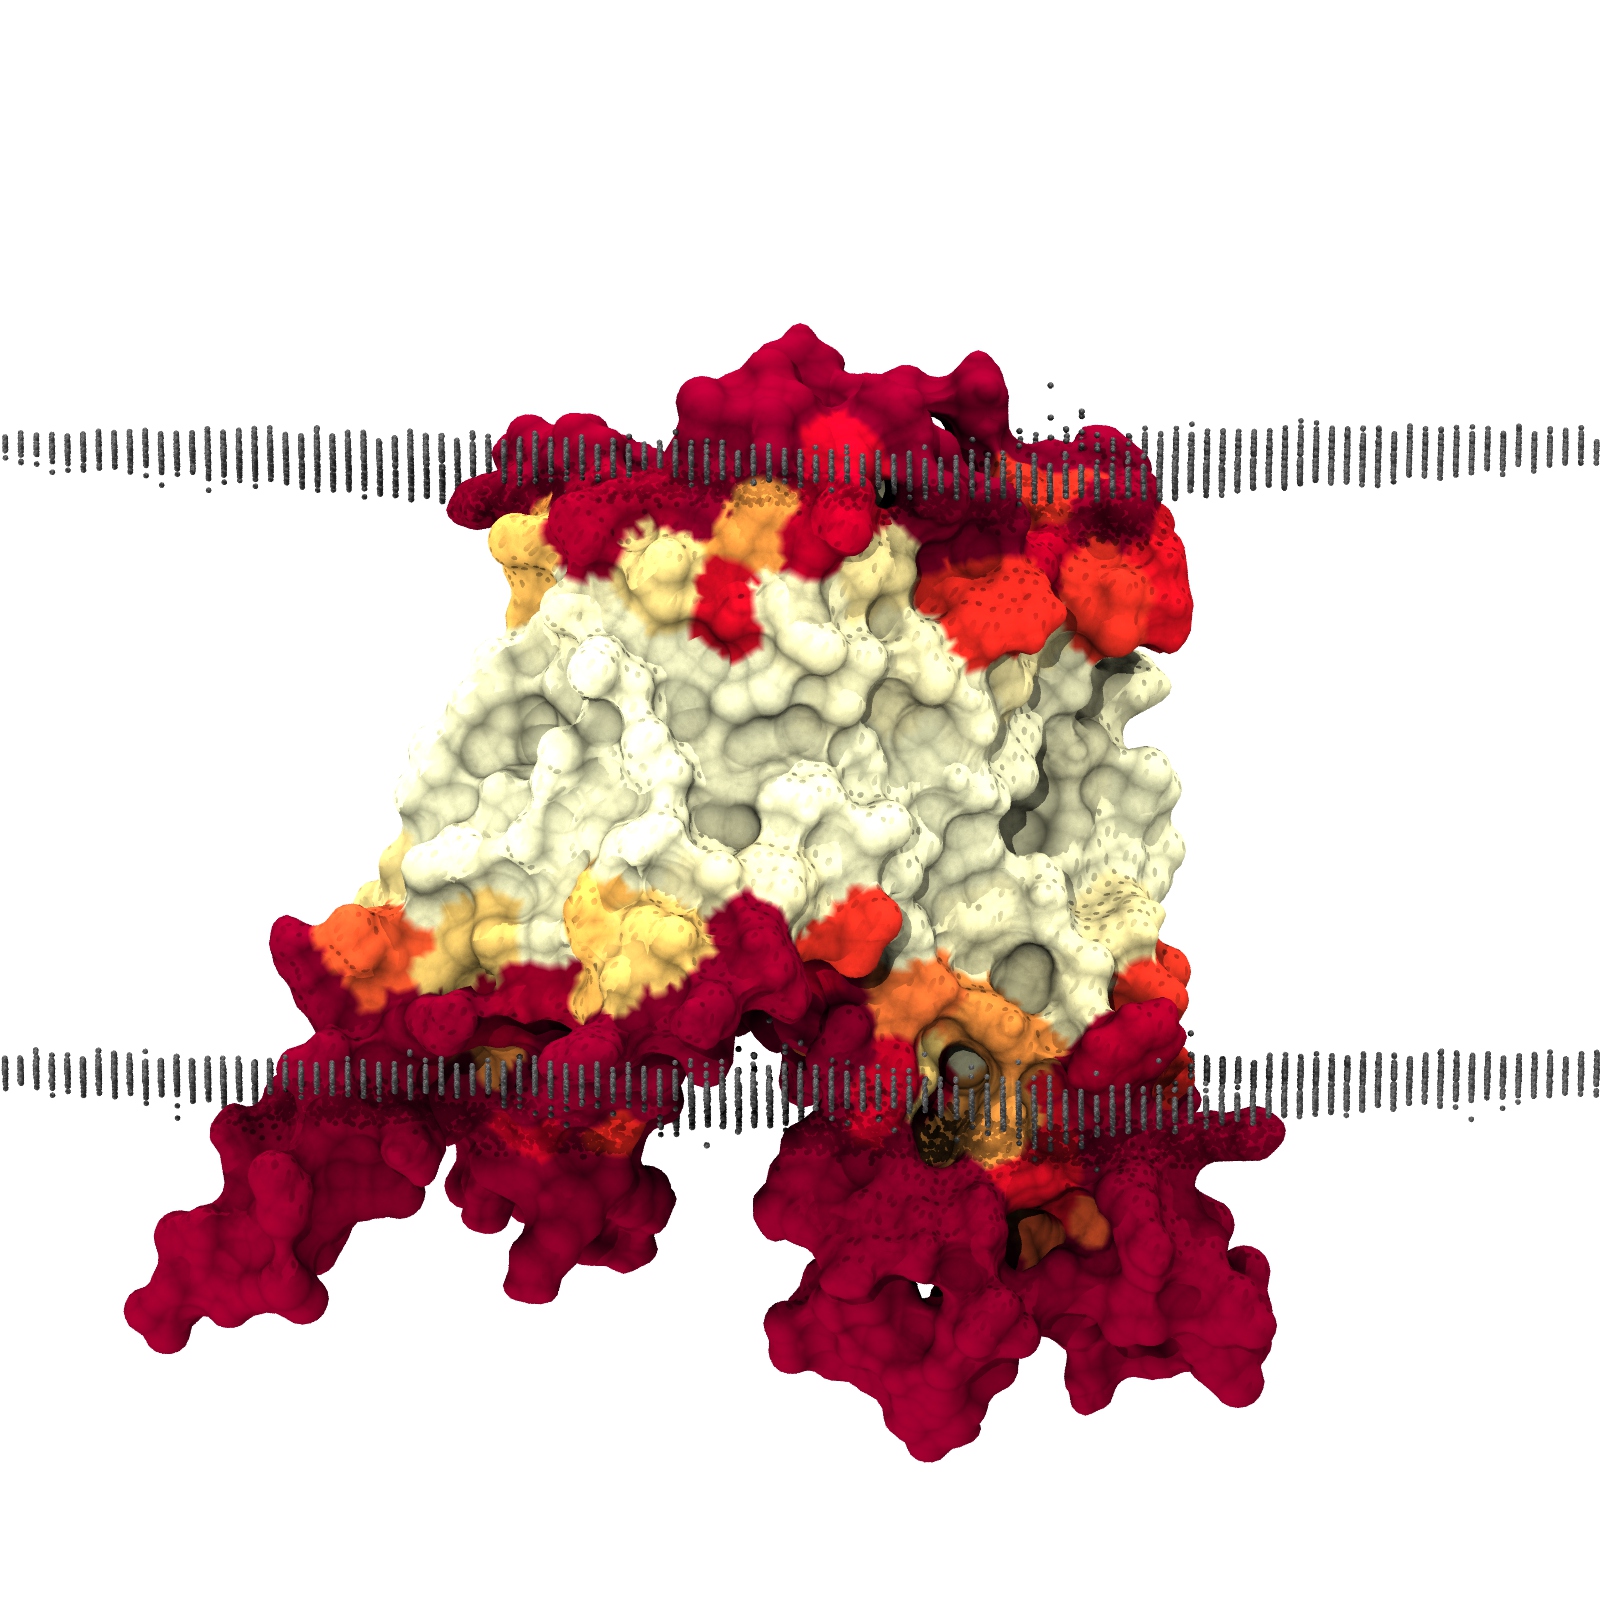
The following pre-rendered images show: distortions of the lipid bilayer, averaged across the entire simulation; positions of lipids in a representative snapshot of the simulation and contacts between lipids or solvent and the protein in either cartoon or surface representation. Rendering is performed using VMD's Tachyon renderer.
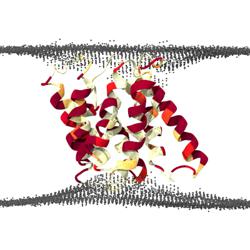
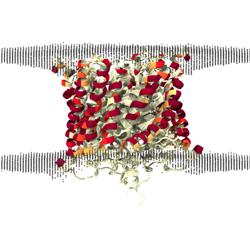
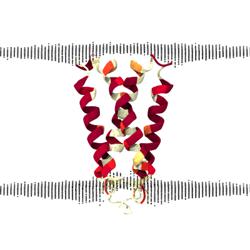
Distortions
Distortions show the average surface formed by lipid phosphate beads over the final 800 ns of simulation time. Red indicates a thinning of the bilayer (compared to bulk thickness), whilst blue indicates thickening.
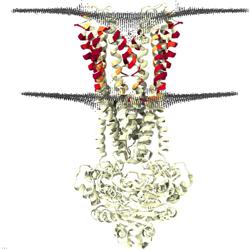
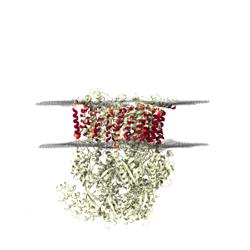
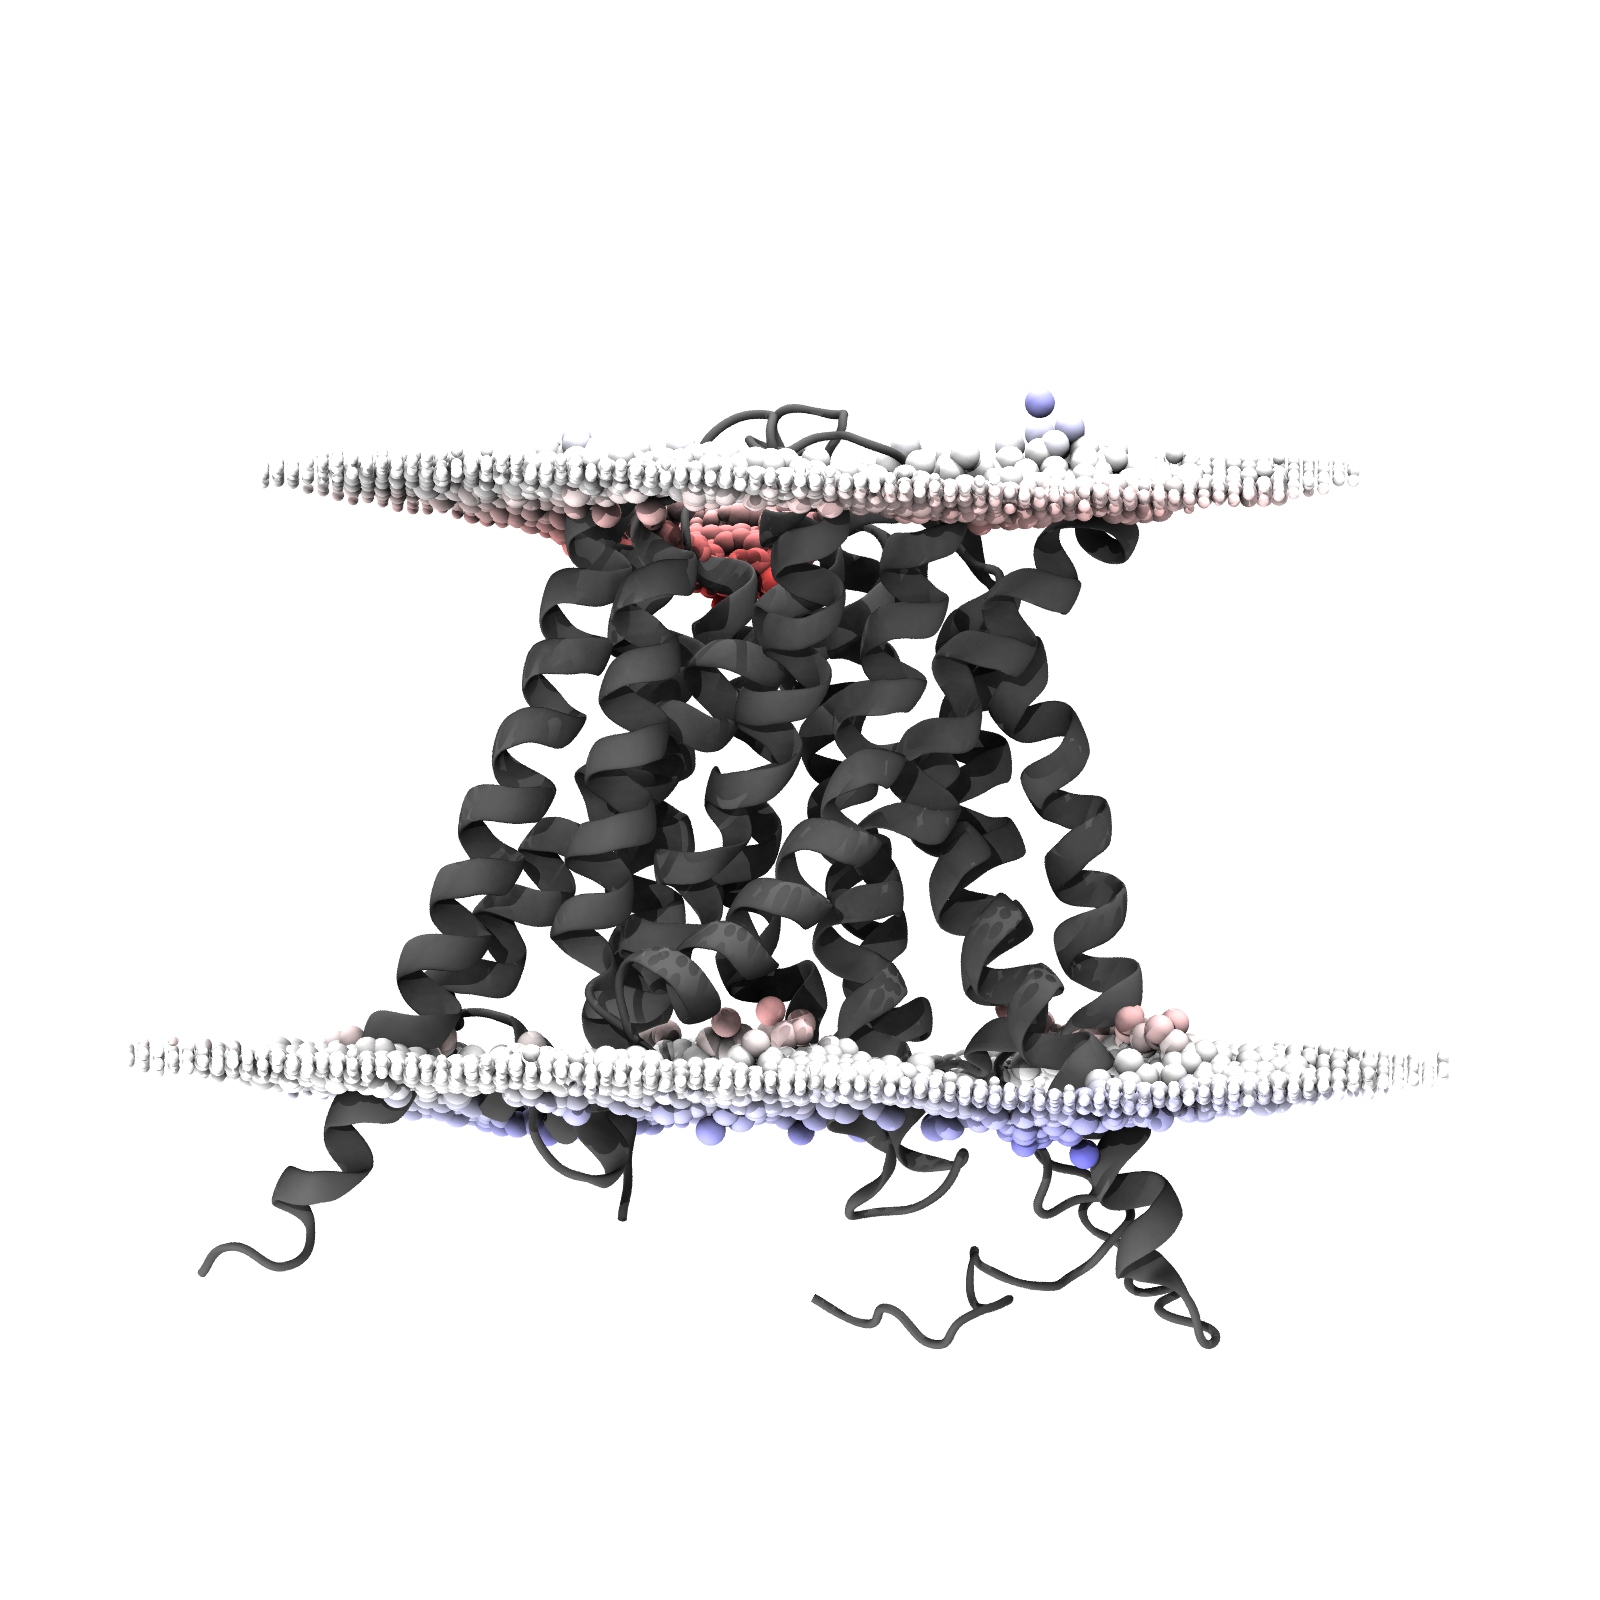
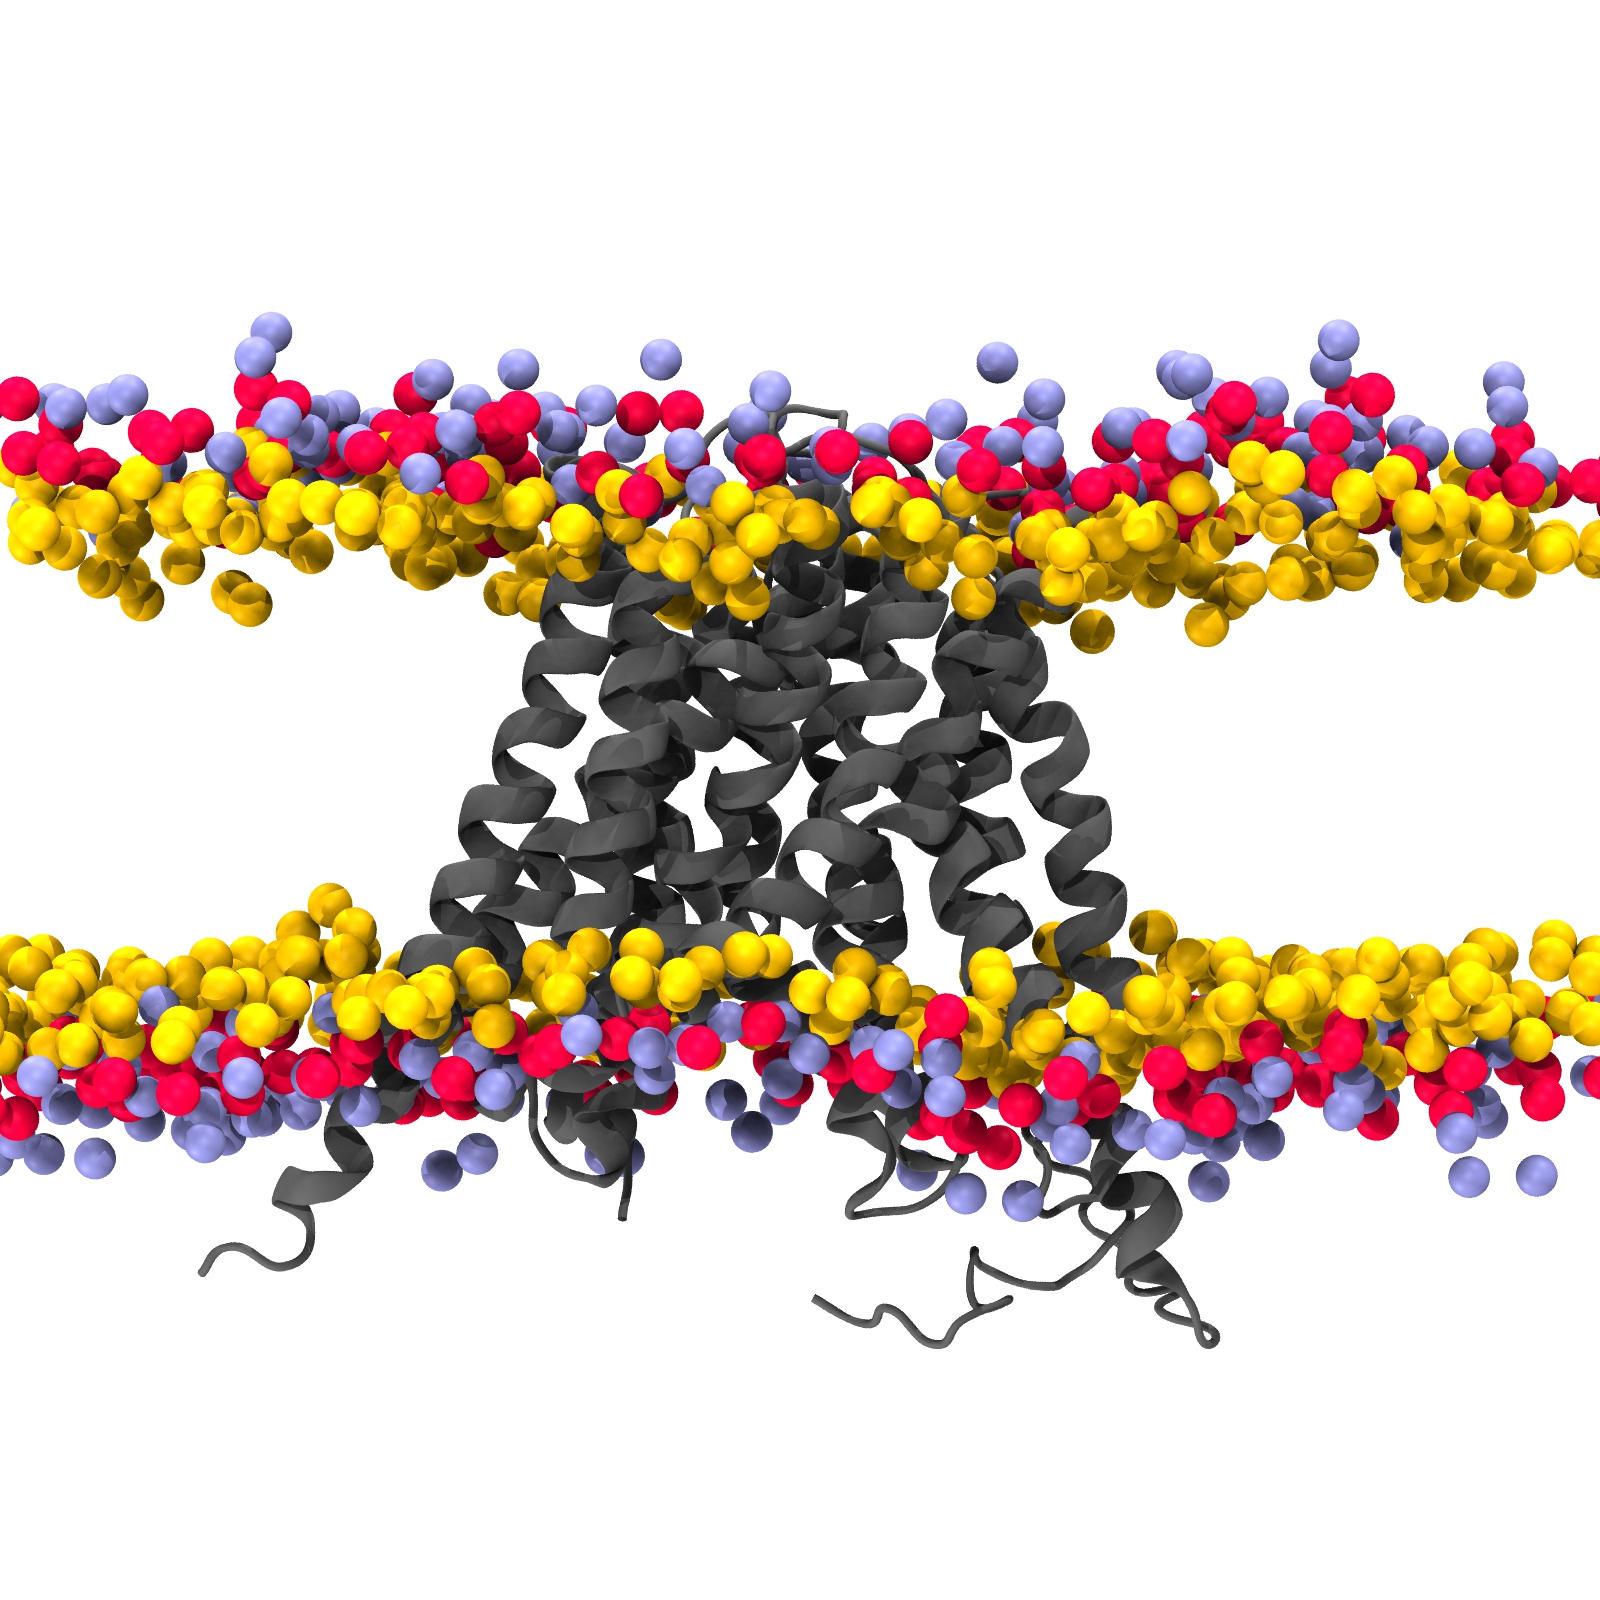
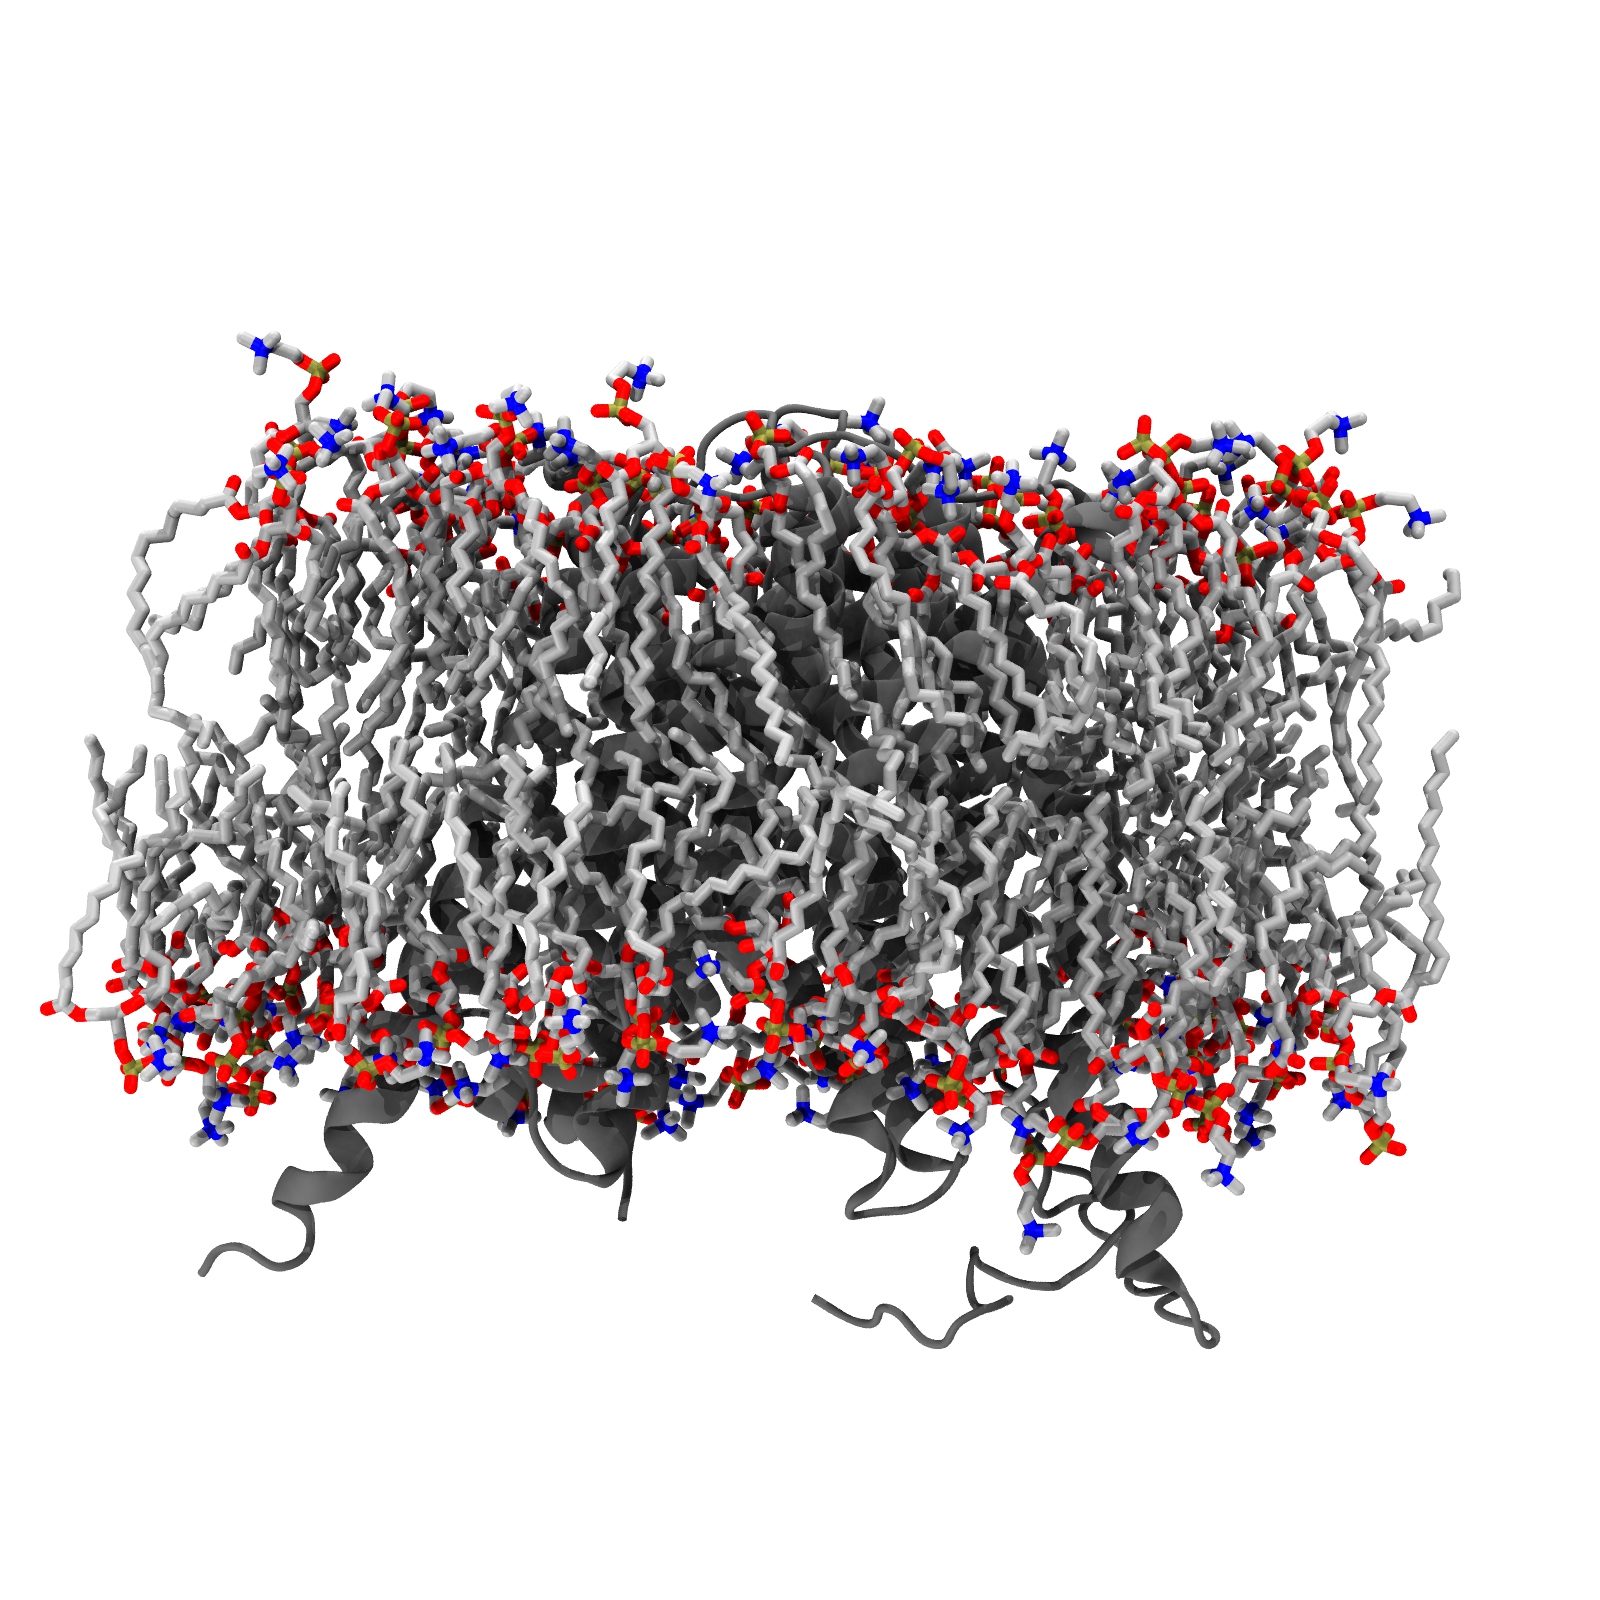
Lipids
Coarse-grained lipids are shown with glycerol beads in yellow, phosphate beads in red and choline beads in blue. Atomistic lipids are coloured according to the CPK standard.
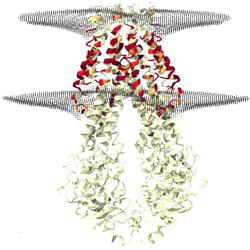
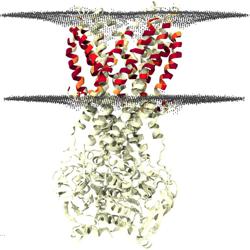
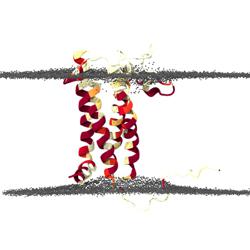
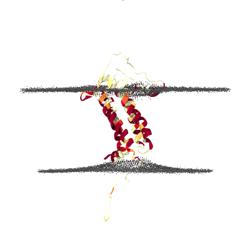
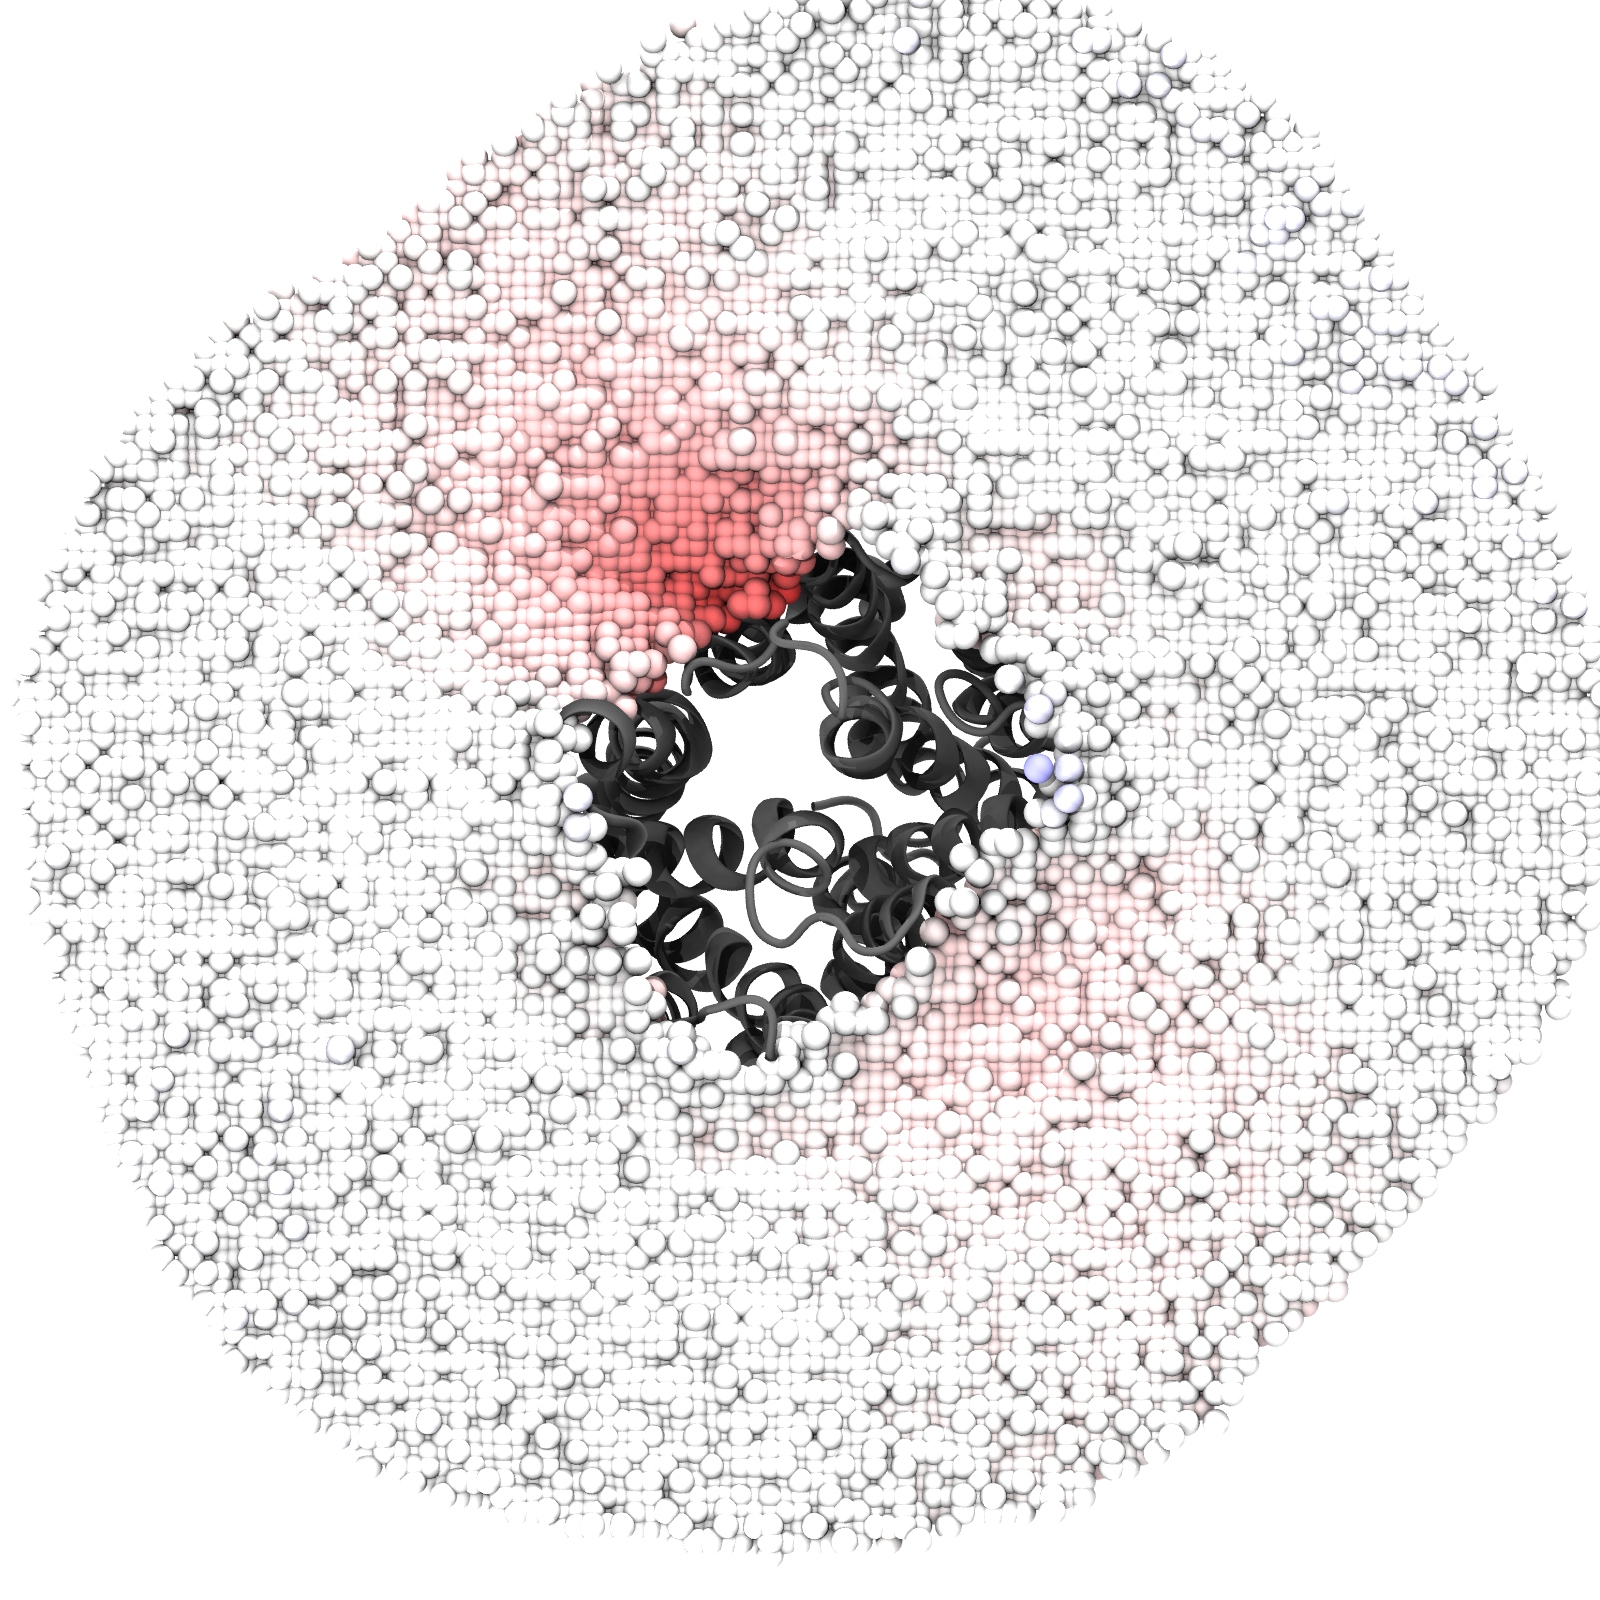
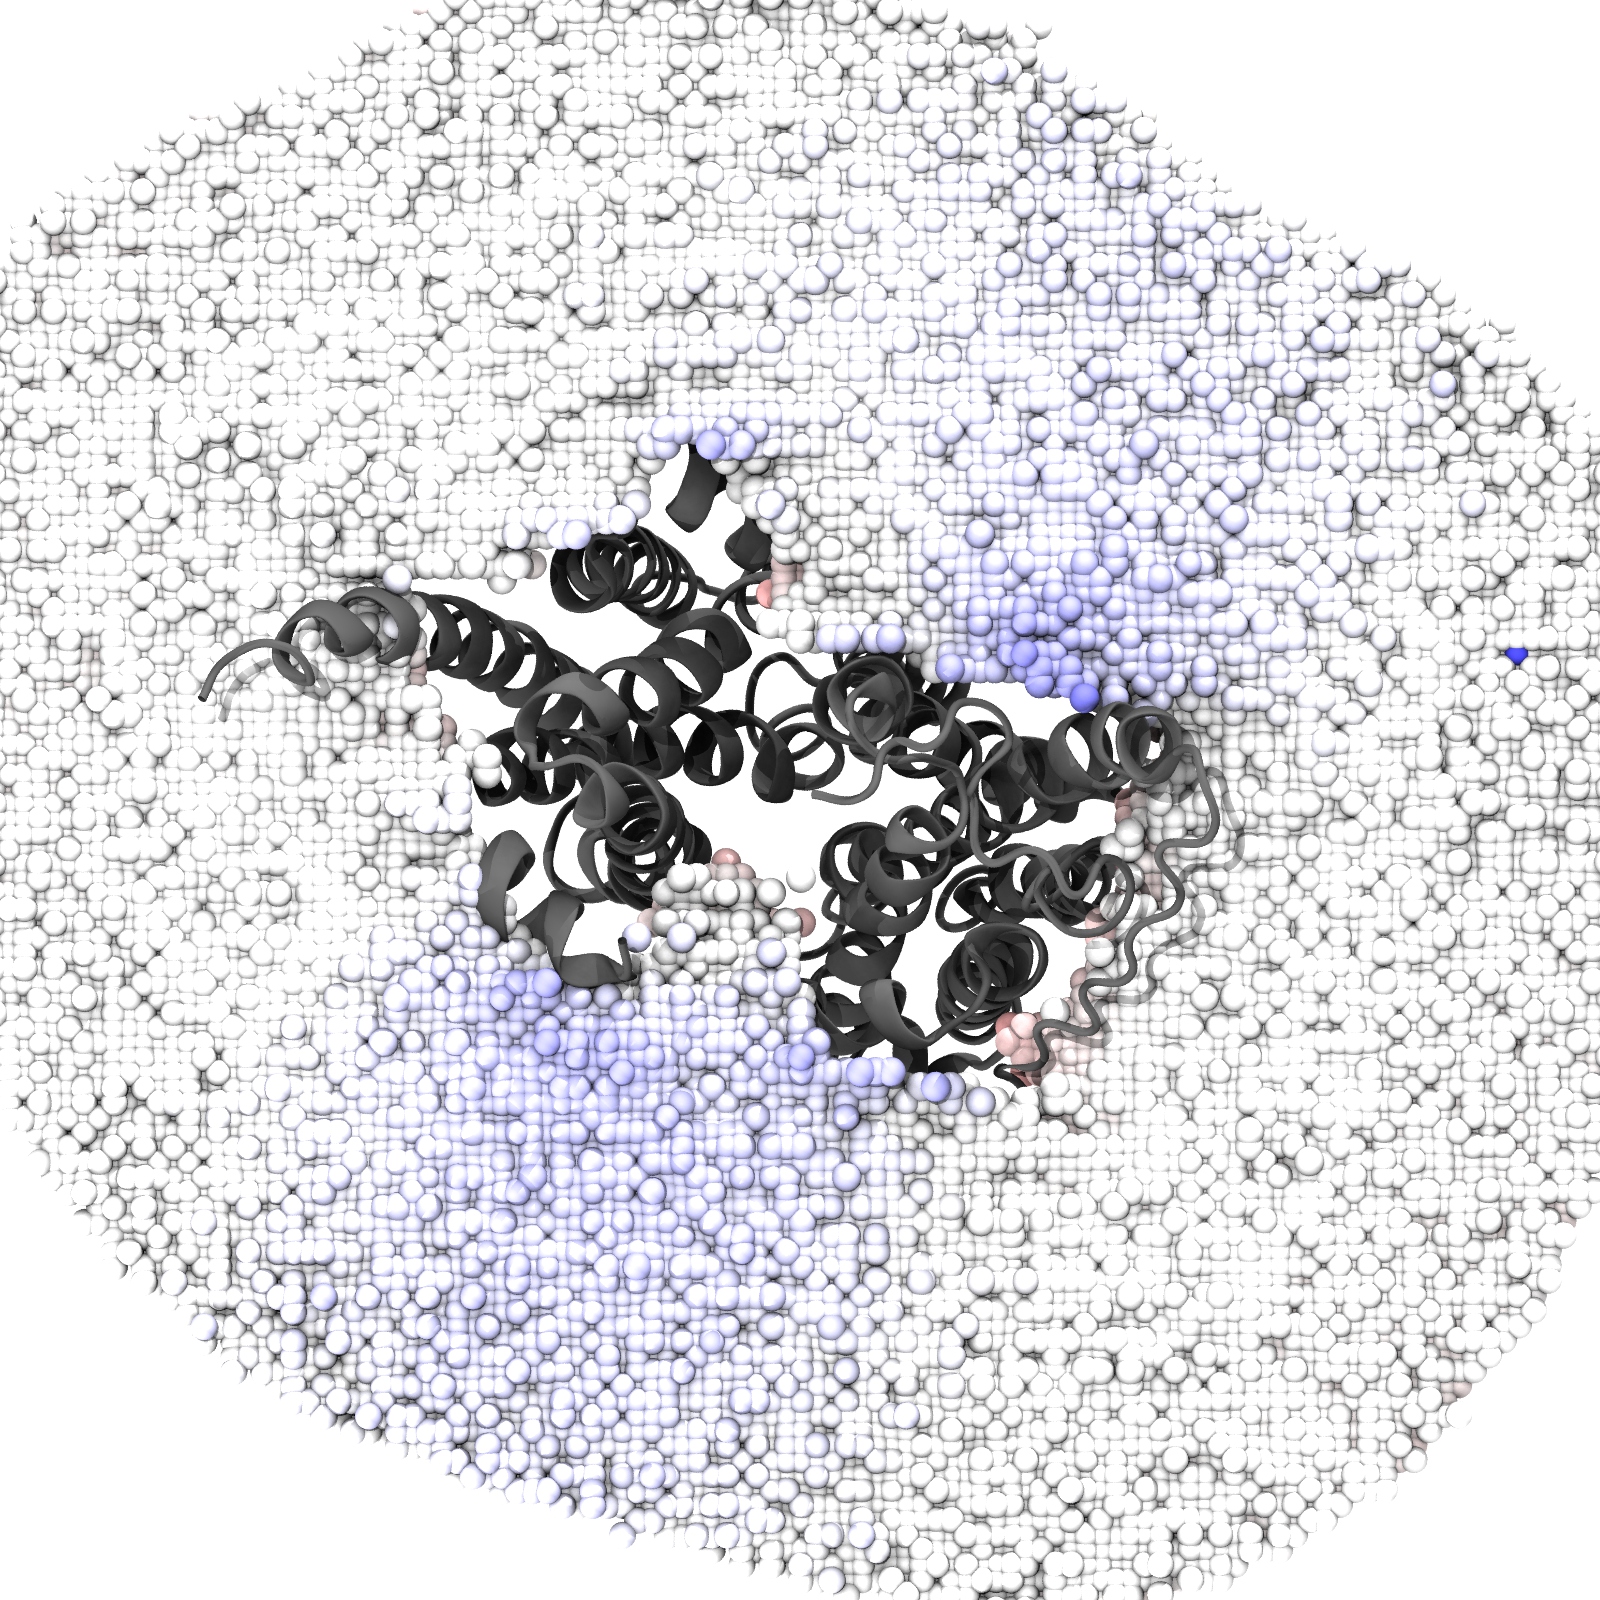
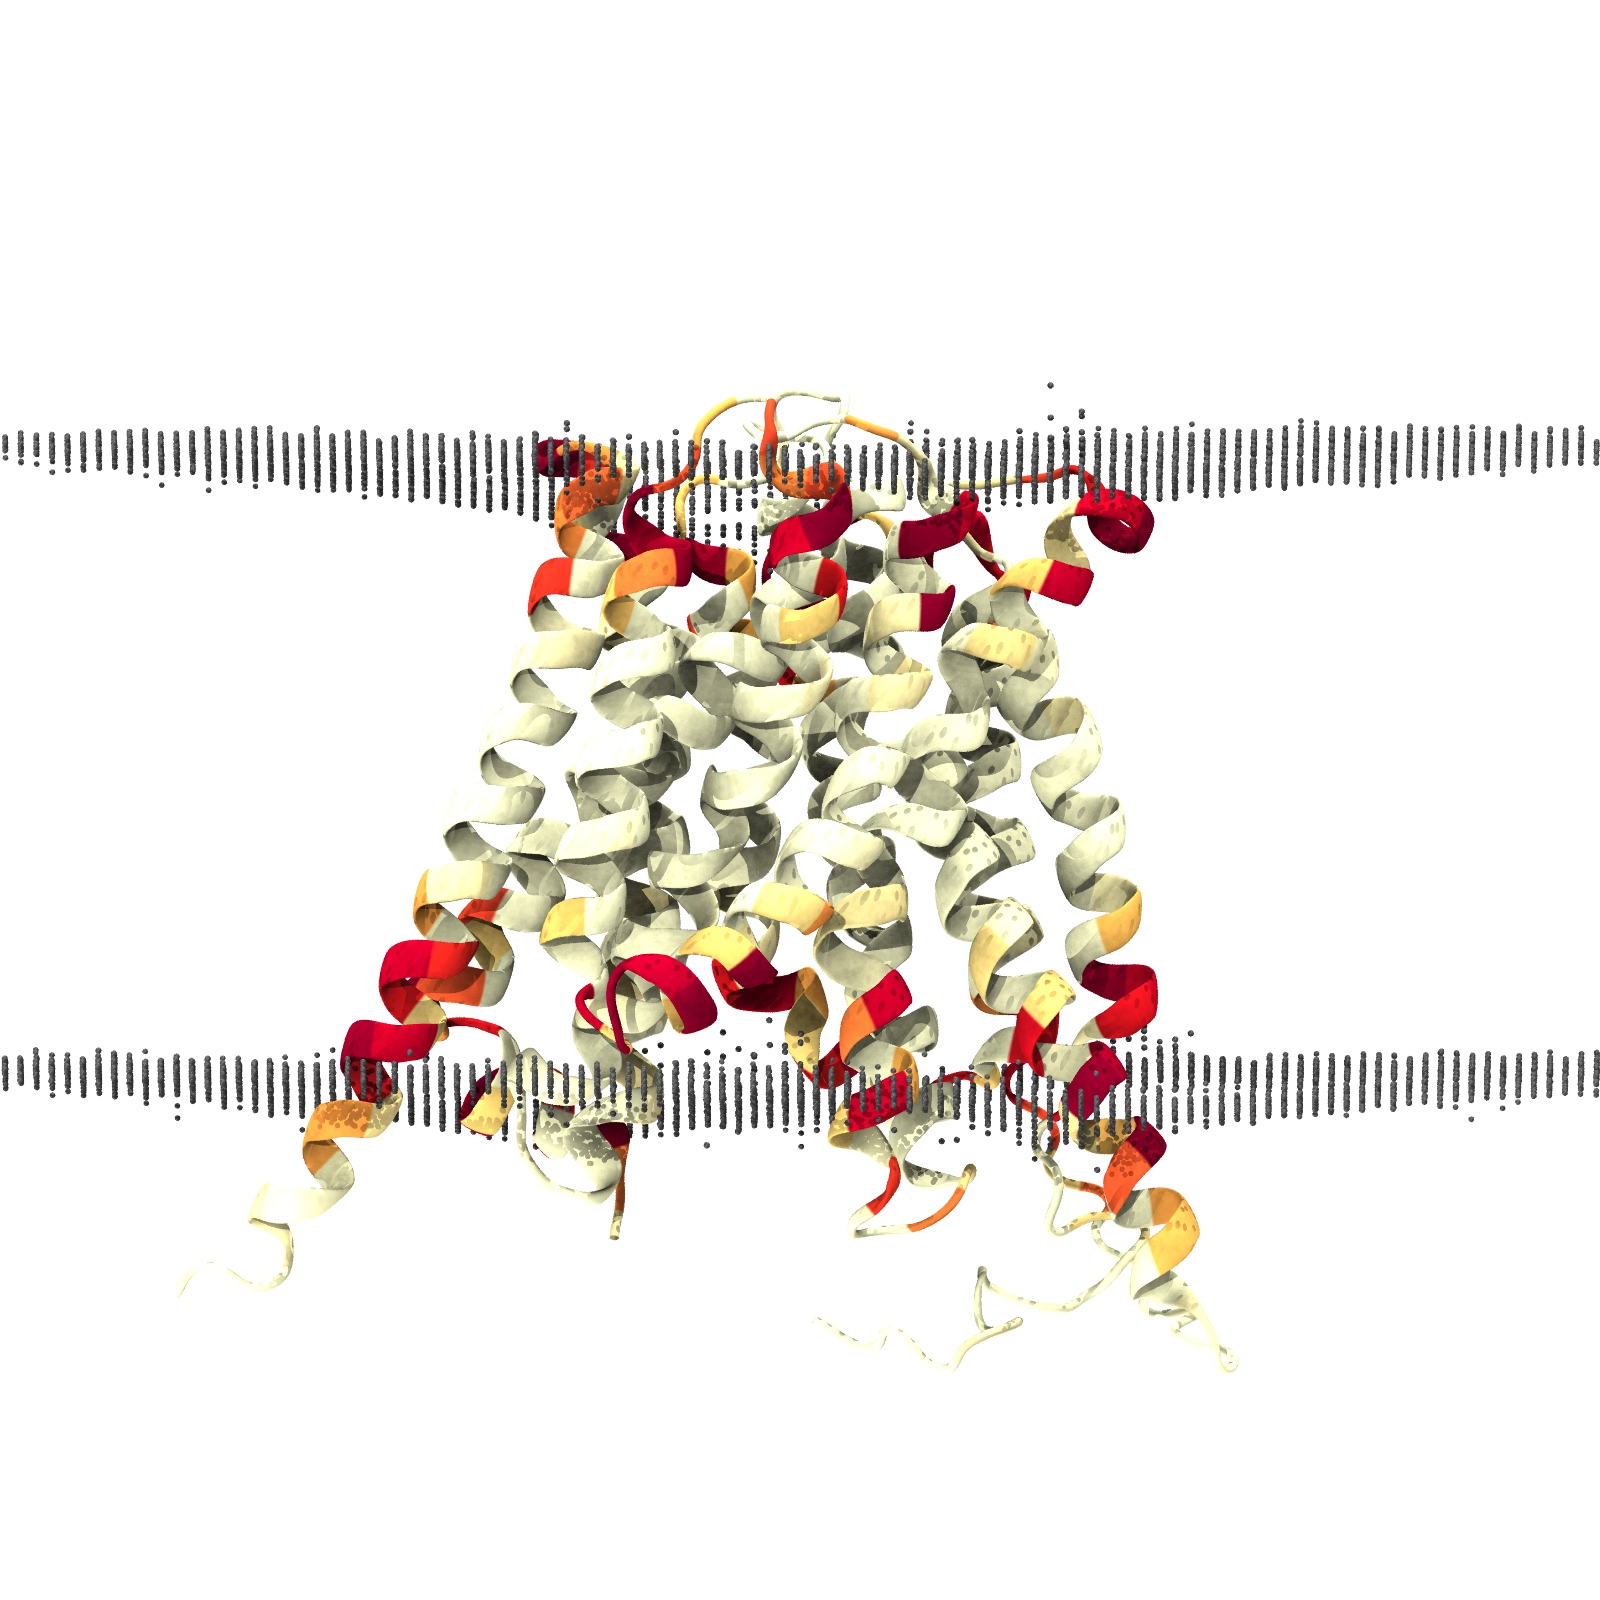
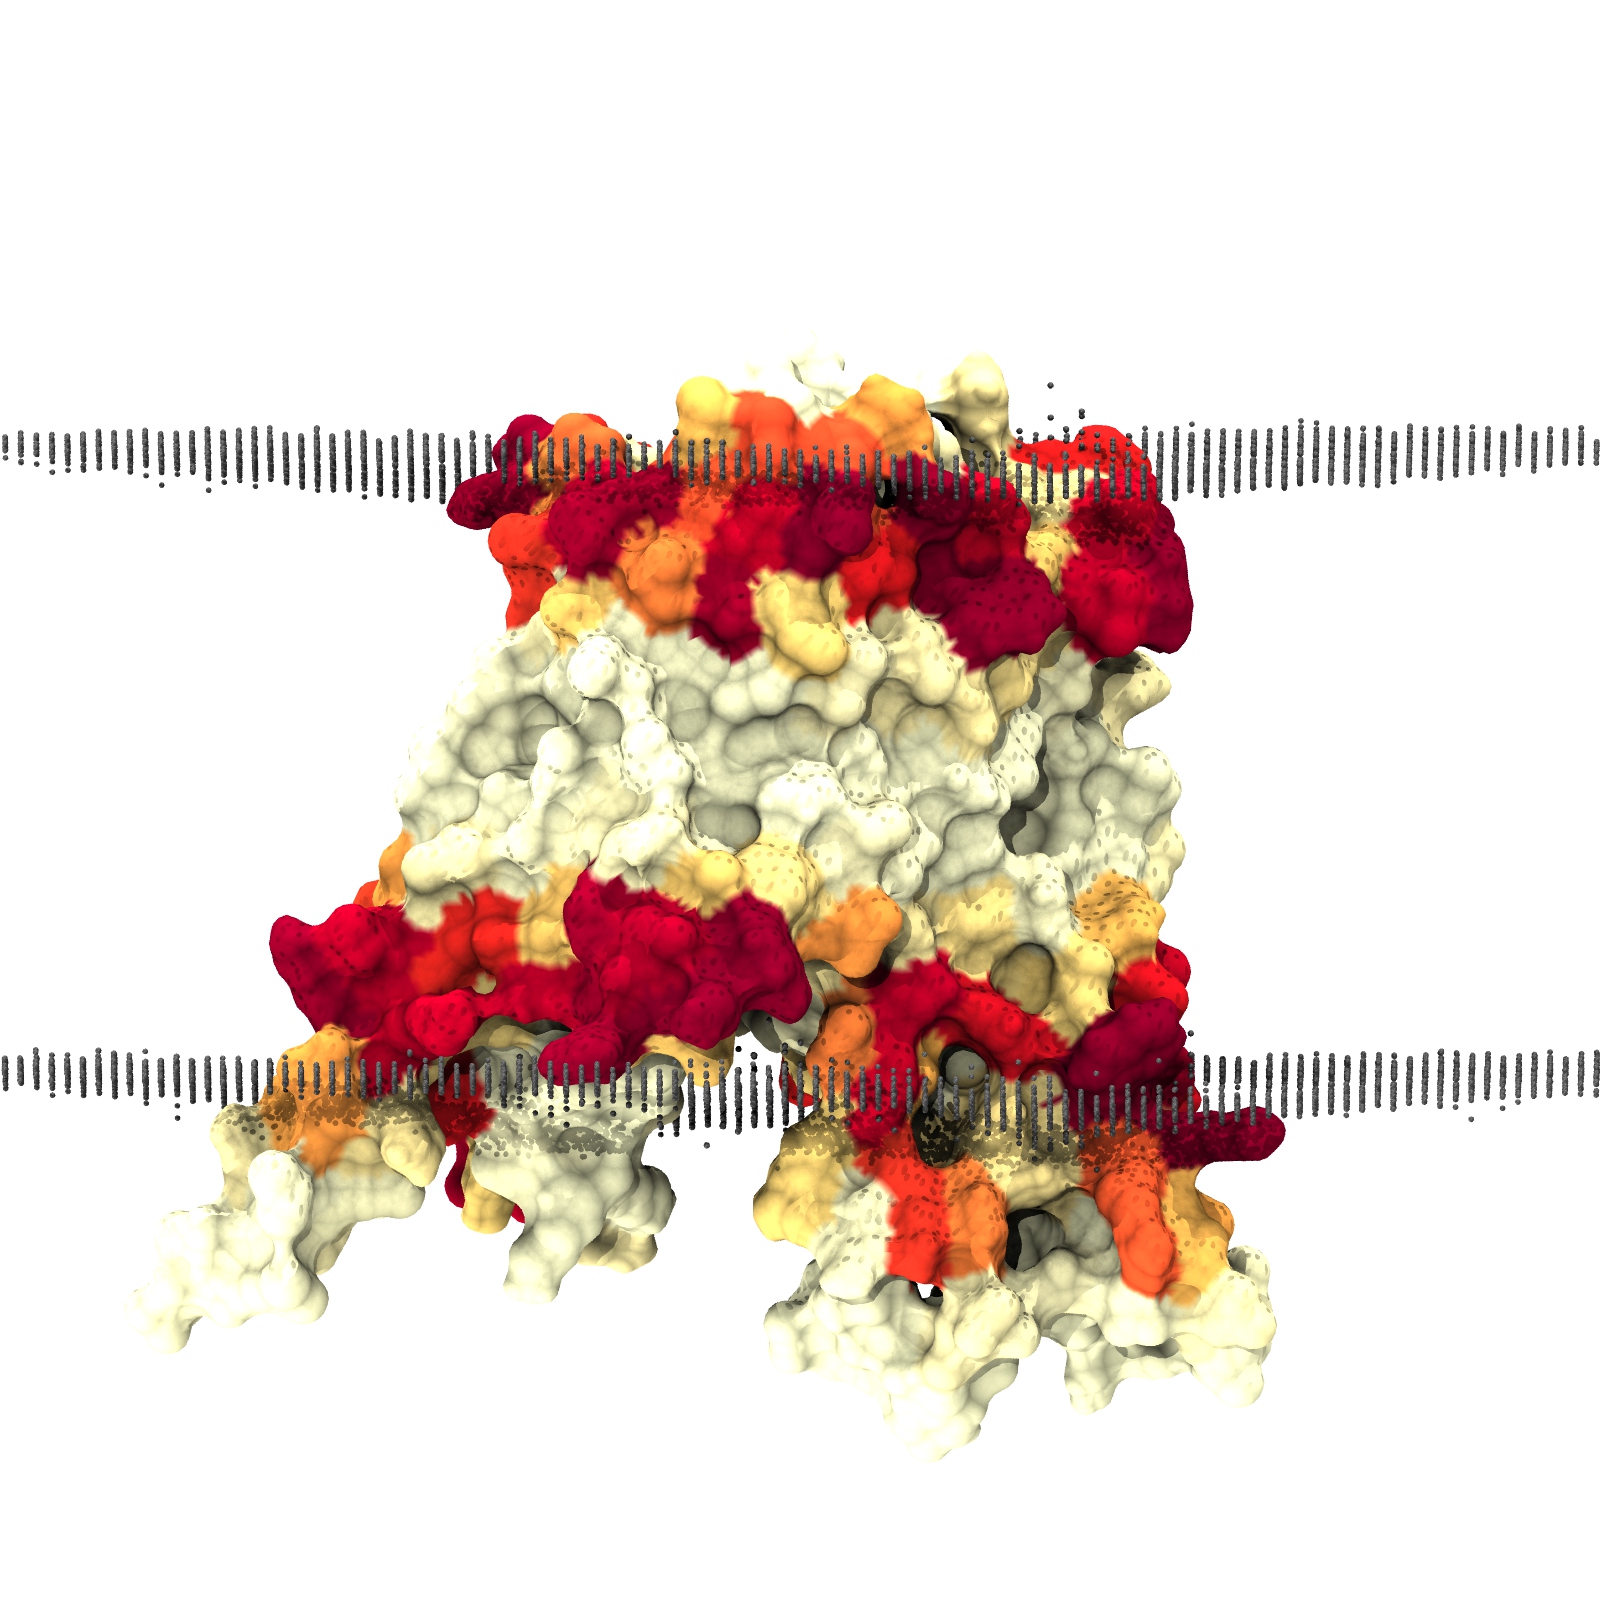
Contacts
Contacts show the average occupancy of the selected group within 6 Å of the protein over the final 800 ns of simulation time. Use the buttons below to select a representation.
Data Download
The following files are available to download and use - hover over to check whether the file is available and click to download. Touch users may need to tap twice to download. Licensed using a Creative Commons Attribution 4.0 International License.
Snapshots
1pw4_default_dppc-ready.pdb
Starting structure used for simulations.
1pw4_default_dppc-atomistic.pdb
Atomistic snapshot created with CG2AT.
1pw4_default_dppc-coarsegrained.pdb
Coarse-grained snapshot (MARTINI representation).
1pw4_default_dppc-distortions.pdb
Distortions (membrane surface representation) in PDB format.
Structures with contacts
1pw4_default_dppc-head-contacts.pdb
Atomistic structure with headgroup contacts as temperature factors.
1pw4_default_dppc-tail-contacts.pdb
Atomistic structure with acyl tail contacts as temperature factors.
1pw4_default_dppc-solvent-contacts.pdb
Atomistic structure with solvent contacts as temperature factors.
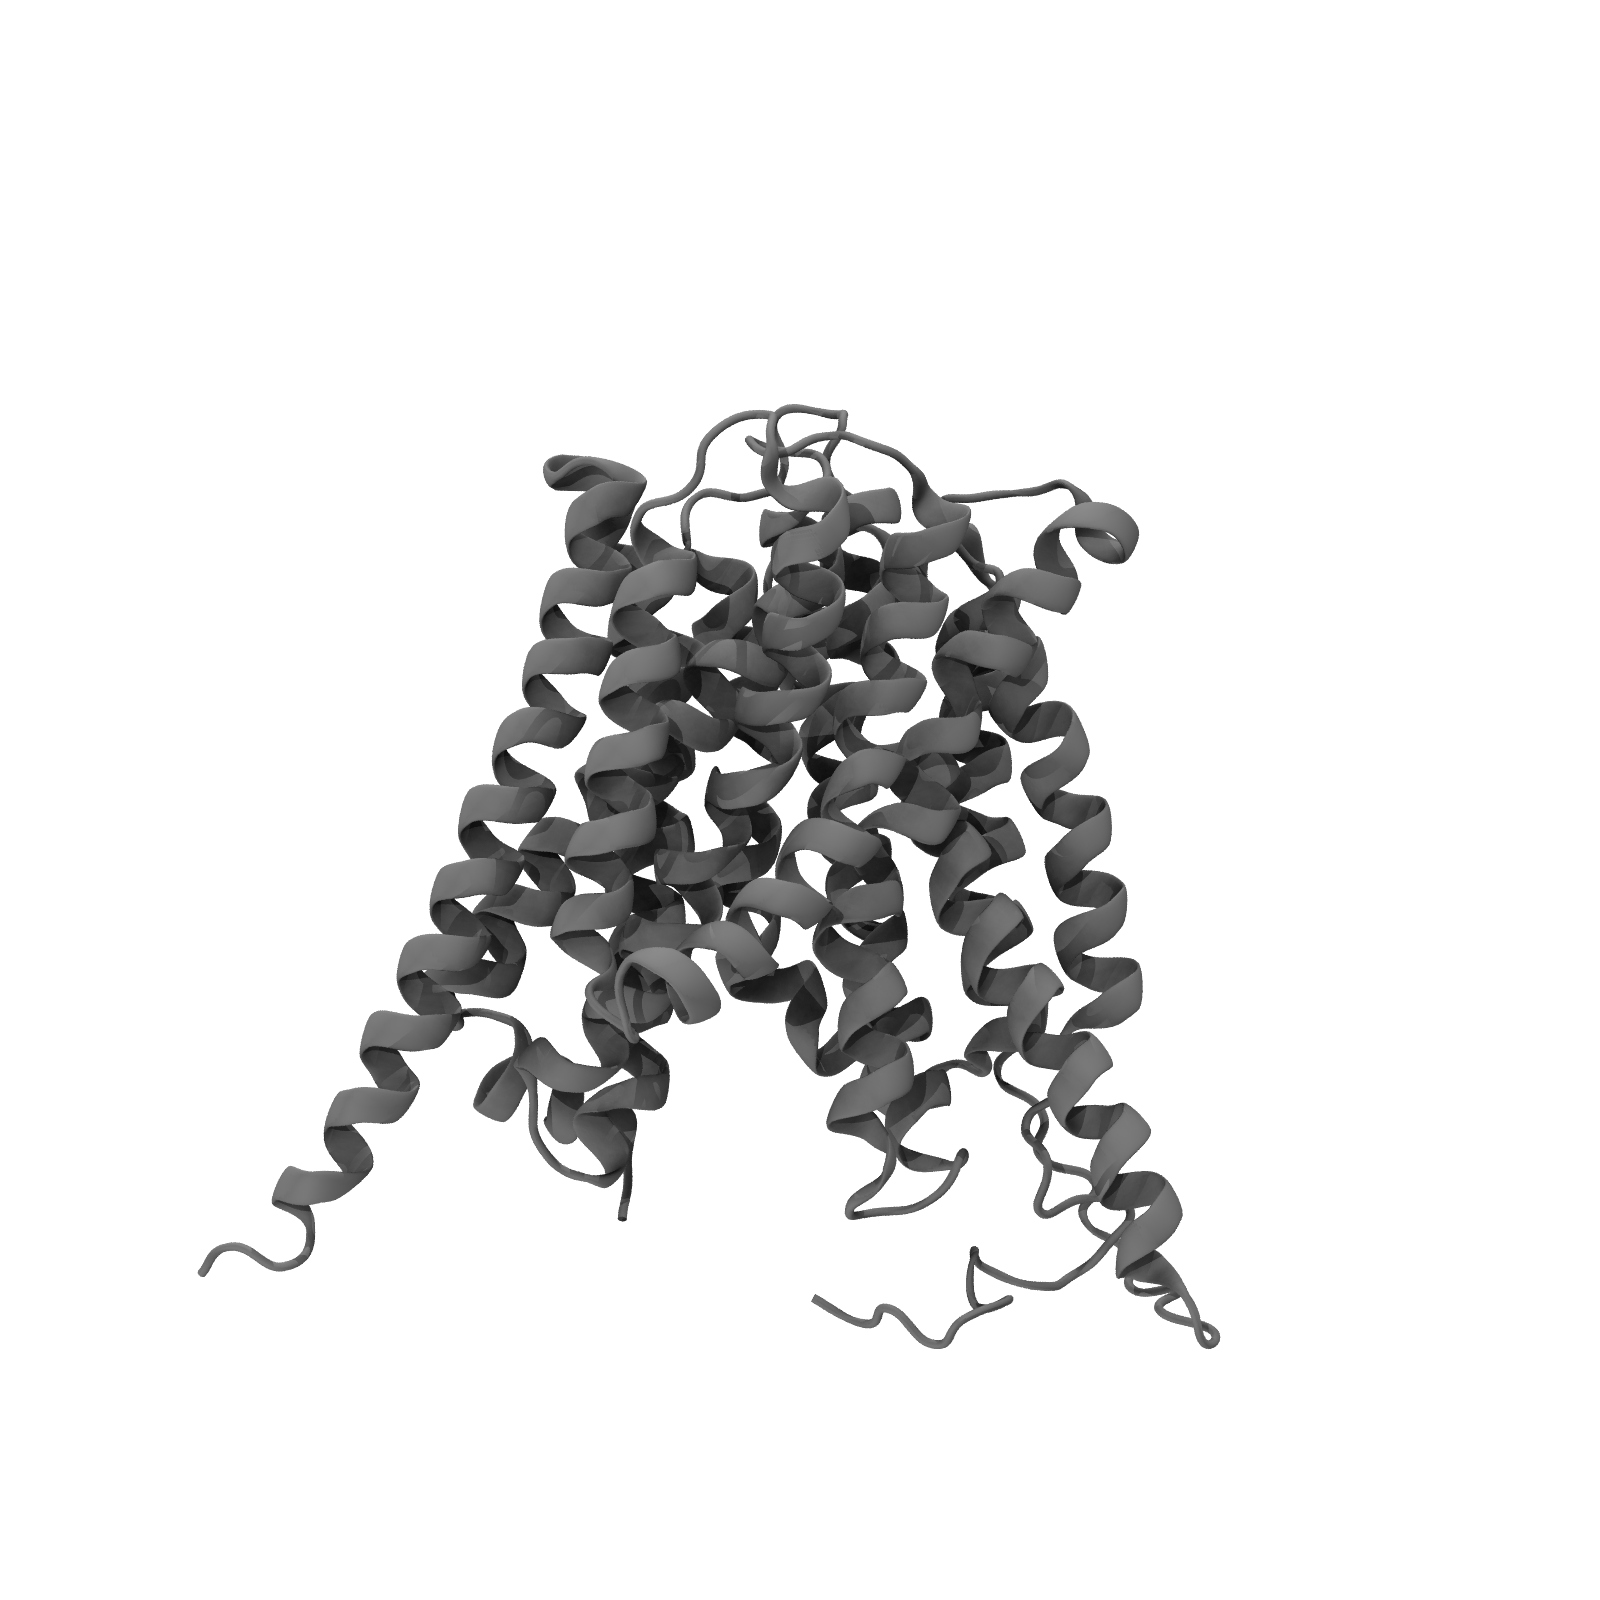
View molecule in 3D
View an atomistic snapshot from this simulation. You will not need to install any additional software or plugins.
check Your browser is ready to display 3D content using WebGL.
checkA structure is available through the MemProtMD API.
infoLoading this file may cause your browser to become briefly unresponsive.
insert_drive_file
1pw4_default_dppc.mpmd.finalframe.atomistic.pdb
1.5 MB, PDB Format
autorenewLoading structure
Show protein as:
Colour protein by:
Show lipids as:
Colour lipids by:
Polypeptide chains
Select a chain to view more detailed analysis. The cards below show a vertical violin plot for each chain, with shapes representing the normalised density of all residues (white), alpha helical residues (blue) and beta sheet residues (green) along the bilayer normal.