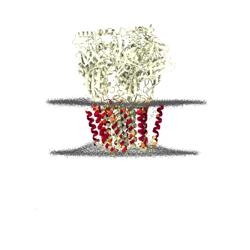
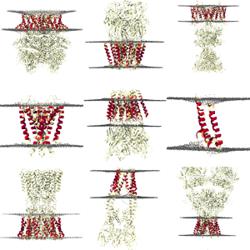
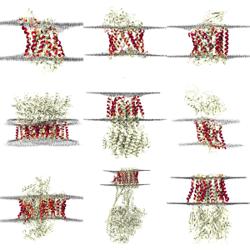
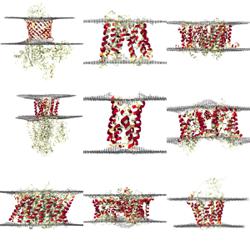
PDB | 8g4o Native GABA-A receptor

Native GABA-A receptor from the mouse brain, alpha1-beta2-gamma2 subtype, in complex with didesethylflurazepam and endogenous GABA

label Keywords
ligand-gated ion channel, cys-loop receptor, neurotransmitter receptor, membrane protein
event_note Published
11/13/2024
filter_center_focus Method
ELECTRON MICROSCOPY
add_circle Ligands
GAMMA-AMINO-BUTANOIC ACID, (5M)-1-(2-aminoethyl)-7-chloro-5-(2-fluorophenyl)-1,3-dihydro-2H-1,4-benzodiazepin-2-one, 2-acetamido-2-deoxy-beta-D-glucopyranose

Original publication

import_contacts Title
Cryo-EM structures reveal native GABA A receptor assemblies and pharmacology.
import_contacts Journal
Nature 2023
import_contacts DOI
10.1038/s41586-023-06556-w
person Authors
Sun, C., Zhu, H., Gouaux, E., Clark, S.

Simulation 8g4o_default_dppc

Images

The following pre-rendered images show: distortions of the lipid bilayer, averaged across the entire simulation; positions of lipids in a representative snapshot of the simulation and contacts between lipids or solvent and the protein in either cartoon or surface representation. Rendering is performed using VMD's Tachyon renderer.

Distortions

Distortions show the average surface formed by lipid phosphate beads over the final 800 ns of simulation time. Red indicates a thinning of the bilayer (compared to bulk thickness), whilst blue indicates thickening.

Lipids

Coarse-grained lipids are shown with glycerol beads in yellow, phosphate beads in red and choline beads in blue. Atomistic lipids are coloured according to the CPK standard.

Contacts

Contacts show the average occupancy of the selected group within 6 Å of the protein over the final 800 ns of simulation time. Use the buttons below to select a representation.

View molecule in 3D

View an atomistic snapshot from this simulation. You will not need to install any additional software or plugins.

check Your browser is ready to display 3D content using WebGL.

checkA structure is available through the MemProtMD API.

errorThis is an extremely large file - loading it may temporarily cause serious performance issues.

insert_drive_file
8g4o_default_dppc.mpmd.finalframe.atomistic.pdb
10 MB, PDB Format

autorenewLoading structure

Show protein as:

Colour protein by:

Show lipids as:

Colour lipids by:

Polypeptide chains

Select a chain to view more detailed analysis. The cards below show a vertical violin plot for each chain, with shapes representing the normalised density of all residues (white), alpha helical residues (blue) and beta sheet residues (green) along the bilayer normal.

Chain A
Chain B
Chain C
Chain D
Chain E
Chain H
Chain J
Chain K
Chain L