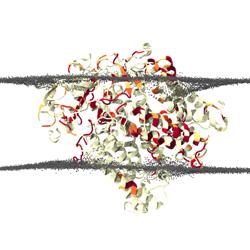
PDB | 2hhk Reaction centre from Rhodobacter sphaeroides strain R-26.1 complexed with dibrominated phosphatidylglycerol

Reaction centre from Rhodobacter sphaeroides strain R-26.1 complexed with dibrominated phosphatidylglycerol

label Keywords
photosynthesis, photosynthetic reaction center, lipid binding sites, brominated lipid, membrane protein, photosynthesis-membrane protein complex
event_note Published
04/03/2024
blur_on Resolution
2.5 Å
filter_center_focus Method
X-RAY DIFFRACTION
add_circle Ligands
BACTERIOCHLOROPHYLL A, BACTERIOPHEOPHYTIN A, UBIQUINONE-10, GLYCEROL, FE (III) ION, CHLORIDE ION, PHOSPHATE ION, CARDIOLIPIN, (1R)-2-{[{[(2R)-2,3-DIHYDROXYPROPYL]OXY}(HYDROXY)PHOSPHORYL]OXY}-1-[(PALMITOYLOXY)METHYL]ETHYL (9S,10S)-9,10-DIBROMOOCTADECANOATE, LAURYL DIMETHYLAMINE-N-OXIDE, POTASSIUM ION, (1S)-2-{[{[(2R)-2,3-DIHYDROXYPROPYL]OXY}(HYDROXY)PHOSPHORYL]OXY}-1-[(PALMITOYLOXY)METHYL]ETHYL STEARATE

Original publication

import_contacts Title
Brominated Lipids Identify Lipid Binding Sites on the Surface of the Reaction Center from Rhodobacter sphaeroides.
import_contacts Journal
Biochemistry 2007
import_contacts DOI
10.1021/bi062154i
person Authors
Roszak, A.W., Gardiner, A.T., Cogdell, R.J., Isaacs, N.W.

Simulation 2hhk_default_dppc

Images

The following pre-rendered images show: distortions of the lipid bilayer, averaged across the entire simulation; positions of lipids in a representative snapshot of the simulation and contacts between lipids or solvent and the protein in either cartoon or surface representation. Rendering is performed using VMD's Tachyon renderer.

Distortions

Distortions show the average surface formed by lipid phosphate beads over the final 800 ns of simulation time. Red indicates a thinning of the bilayer (compared to bulk thickness), whilst blue indicates thickening.

Lipids

Coarse-grained lipids are shown with glycerol beads in yellow, phosphate beads in red and choline beads in blue. Atomistic lipids are coloured according to the CPK standard.

Contacts

Contacts show the average occupancy of the selected group within 6 Å of the protein over the final 800 ns of simulation time. Use the buttons below to select a representation.

View molecule in 3D

View an atomistic snapshot from this simulation. You will not need to install any additional software or plugins.

check Your browser is ready to display 3D content using WebGL.

checkA structure is available through the MemProtMD API.

infoLoading this file may cause your browser to become briefly unresponsive.

insert_drive_file
2hhk_default_dppc.mpmd.finalframe.atomistic.pdb
2.3 MB, PDB Format

autorenewLoading structure

Show protein as:

Colour protein by:

Show lipids as:

Colour lipids by:

Polypeptide chains

Select a chain to view more detailed analysis. The cards below show a vertical violin plot for each chain, with shapes representing the normalised density of all residues (white), alpha helical residues (blue) and beta sheet residues (green) along the bilayer normal.

Chain H
Chain L
Chain M